 The Leading Economic Indicators for February 2014 highlights trends in Consumer Price Indices (CPI) and inflation, interest rates, exchange rates, international trade, agriculture, energy, manufacturing, building and construction, tourism and transport.
MACROECONOMIC INDICATORS
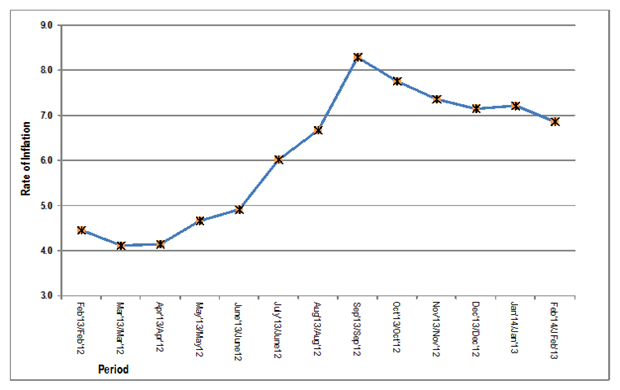
Consumer Price Index (CPI) increased from 143.40 points in January 2013 to 145.95 points in February 2014. The overall rate of inflation dropped from 7.21 per cent to 6.86 per cent during the same period. During the month of February, the Kenyan Shilling appreciated against the Euro, the South African Rand, and the Tanzanian shilling exchanging at an average of KSh 112.94, KSh KSh 7.86, and KSh18.82, respectively. On the other hand, the Kenyan Shilling depreciated against the US dollar, the Sterling Pound, the Japanese Yen, and the Ugandan Shilling over the same period.
The average yield rate for the 91-day Treasury bills, which is a benchmark for the general trend of interest rates, decreased from 9.26 per cent in January 2014 to 9.16 per cent in February 2014. The inter-bank rates fell from 10.65 per cent to 9.06 per cent during the period. The Nairobi Securities Exchange share index (NSE 20) increased from 4,856 points in January 2014 to 4,933 points in February 2014, while the total number of shares traded contracted from KSh 639 million to KSh 545 million shares during the same period. The total value of NSE shares traded decreased from KSh 16.0 billion to KSh 14.7 billion over the same period. Broad money supply (M3), a key indicator for monetary policy formulation, increased from KSh 1,982.6 billion in January 2014 to KSh 1,988.1 billion in February 2014. Gross Foreign Exchange Reserves contracted from KSh 741.2 billion in January 2014 to KSh 721.1 billion in February 2014 while Net Foreign Exchange Reserves decreased to KSh 378.7 billion over the same period.
AGRICULTURE
The quantity of coffee auctioned at the Nairobi Coffee Exchange increased from 2,133 MT in December 2013 to 2,850 MT in January 2014 while its average auction price increased from KSh 274.39 per kilogram to KSh 293.39 per kilogram in the same period. The quantity of processed tea went up from 41,719 MT in December 2013 to 44,970 MT in January 2014 while its average auction price increased from KSh 211.62 to KSh 235.57 per kilogram over the same period.
Average price for dry maize rose from KSh 37.69 per kilogram in January 2014 to KSh 38.53 per kilogram in February 2014 while the average price for dry beans averaged KSh 78.46 per Kilogram in February 2014. Milk deliveries to the formal sector increased from 47.0 million litres in December 2013 to 50.1 million litres in January 2014.
INTERNATIONAL TRADE
Quantity of coffee exported increased from 2,675.0 MT in December 2013 to 3,168.9 MT in January 2014 while its value went up from KSh 862.3 million to KSh 1,054.8 million over the same period. The quantity of tea exported decreased from 38,740.7 MT in December 2013 to 38,651.91MT in January 2014, while its value increased from KSh 7,991.4 million to KSh 8,784.3 million during the same period. The quantity of horticultural exports declined from 17,689.28 metric Tonnes in November to 16,165.40 metric Tonnes in December, 2013 while the value dropped from KSh 7,290.41 million to KSh 7,182.38 in the same period.
Volume of trade went up from KSh 159.3 billion in December 2013 to KSh 173.2 billion in January 2014. The total value of exports increased from KSh 40,308.3 million to 43,062.5 million during the same period. Value of imports rose to KSh 130,116.5 million in January 2014 from KSh 118,982.3 in December 2013. Domestic exports by Broad Economic Category (BEC) indicated that food and beverages was the main export category in January 2014 and accounted for 43.0 per cent of exports, while the value of non-food industrial supplies and consumer goods not elsewhere specified registered 25.9 and 27.9 per cent shares, respectively. Imports by Broad Economic Category (BEC) indicate that industrial supplies (non-food) was the main import category in January 2014 with a share of 32.7 per cent, while the values of fuel and lubricants, machinery & other capital equipment and transport equipment registered shares of 22.9, 16.5 and 10.5 per cent respectively. Food and beverage recorded a share of 6.21 per cent while Consumer goods not elsewhere specified recorded a share of 7.1 per cent.
ENERGY
Total electricity generation declined from 757.28 million KWh in January 2014 to 685.24 million KWh in February 2014. Domestic consumption of electricity rose from 611.26 million KWh in January 2014 to 662.30 million KWh in February 2014. The total consumption of petroleum products dropped to 289.58 thousand MT in January 2014 from 305.63 thousand MT realized in December 2013. Average national domestic oil prices of motor gasoline premium rose to retail at KSh 112.37 per litre in February 2014 from KSh 111.41 per litre retailed in January 2014. The price of light diesel rose to retail at KSh 106.72 in February 2014 from KSh 105.65 in December 2013. The average price for Kerosene decreased to retail at KSh 83.99 from KSh 85.98 during the same period. The price of a 13-Kg cylinder of gas averaged KSh 3,027.03. In the international market, the price of Murban crude oil increased from US Dollars 109.75 per barrel in January 2013 to US Dollars 109.95 per barrel in February 2014.
MANUFACTURING, BUILDING AND CONSTRUCTION
Domestic production of sugar decreased from 54,752 MT in November 2013 to 53,994 MT in December 2013. Production of soft drinks increased from 37,006 MT in November 2013 to 41,779 MT in December 2013. The production of new assembled vehicles decreased from 986 vehicles in November 2013 to 788 vehicles in December 2013. The production of galvanized sheets fell from 26,421 MT in November 2013 to 22,965 MT in December 2013. The quantity of cement produced went up from 410,173 MT in December 2013 to 430,588 MT in January 2014. Consumption of cement increased from 362,140 MT recorded in December 2013 to 363,437 MT in January 2014.
TOURISM AND TRANSPORT
The total number of visitors arriving through Jomo Kenyatta (JKIA) and Moi International Airports decreased from 101,407 persons in November 2013 to 100,310 persons in December 2013.The number of passengers who embarked at Jomo Kenyatta International Airport (JKIA) went up from 178,418 persons in December 2013 to 178,562 persons in January 2014, while passengers who landed increased from 178,150 persons to 178,387 persons in the same period. The total number of vehicles registered declined from 15,411 vehicles in January 2014 to 17,780 vehicles in February 2014. Station Wagon and Motor cycles accounted for 15.4 per cent and 60.3 per cent respectively of the total motor vehicles registered in February 2014.
Download full report
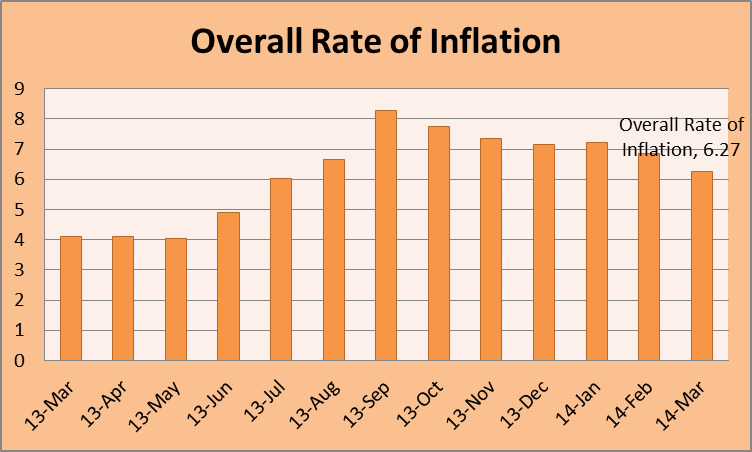 Kenya National Bureau of Statistics hereby releases Consumer Price Indices (CPI) and rates of inflation for March 2014. These numbers have been generated using data collected during the second and third weeks of the month under review. The prices were obtained from selected retail outlets in 25 data collection zones located in 13 urban centers.