 Consumer Price Index (CPI) increased from 139.52 points in May 2013 to 139.59 points in June 2013. The overall rate of inflation rose from 4.05 per cent to 4.91 per cent during the period Read More
Consumer Price Index (CPI) increased from 139.52 points in May 2013 to 139.59 points in June 2013. The overall rate of inflation rose from 4.05 per cent to 4.91 per cent during the period Read More
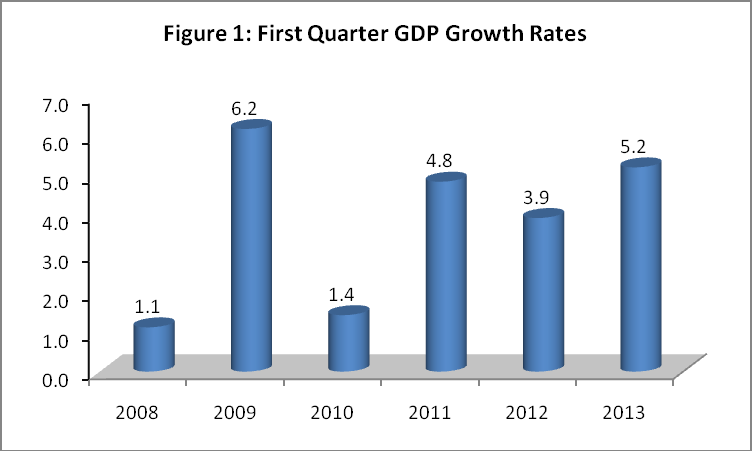 The economy grew by 5.2 per cent during the first quarter of 2013 compared to a growth of 3.9 per cent realized during the same quarter of 2012.
 CPI increased by 0.05 per cent from 139.52 in May 2013 to 139.59 in June 2013. The overall inflation rate stood at 4.91 per cent in June 2013 Read More.
 Consumer Price Index (CPI) increased from 139.28 points in April 2013 to 139.52 points in May 2013. The overall rate of inflation fell from 4.14 per cent to 4.05 per cent during the period Read More
CPI increased by 0.17 per cent from 139.28 in April 2013 to 139.52 in May 2013. The overall inflation rate stood at 4.05 per cent in May 2013..Read more..

Consumer Price Index (CPI) increased by 0.95 per cent from 137.96 points in March 2013 to 139.28 points in April 2013. The overall rate of inflation increased to 4.14 per cent from 4.11 per cent in the same period. Read More..
 The CPI increased by 0.95 per cent from 137.96 in March 2013 to 139.28 in April 2013. The overall inflation rate stood at 4.14 per cent in April 2013. Download…
Consumer Price Index (CPI) increased by 1.01 per cent from 136.59 points in February 2013 to 137.96 points in March 2013. The overall rate of inflation stood at 4.11 per cent from 4.45 per cent in the same period. Read More
The CPI increased by 1.01 per cent from 136.59 in February 2013 to 137.96 in March 2013. The overall inflation rate stood at 4.11 per cent in March 2013.Read more..
 Consumer Price Index (CPI) increased by 1.02 per cent from 135.62 points in January 2013 to 136.59 points in February 2013. The overall rate of inflation increased by 0.78 percentage points to 4.45 per cent from 3.67 per cent in the same period. The Kenyan Shilling appreciated against worlds’ major currencies; the US dollar, the Sterling Pound, the Euro, Japanese Yen and the Ugandan shilling to exchange at an average of KSh 86.2361, 130.736, 113.453, 93.2524 and 30.6312, respectively, as at the end of February 2013. However, the shilling depreciated against the South African rand and the Tanzanian shilling.
The average yield rate for the 91-day Treasury bills, which is a benchmark for the general trend of interest rates, increased from 8.097 per cent in January 2013 to 8.384 in February 2013. The inter-bank rates was 9.047 during the period. The Nairobi Stock Exchange share index (NSE 20) increased from 4,417 points in January 2013 to 4,519 points in February 2013, while the total number of shares traded increased substantially by 33.33 per cent from 519 million shares traded to 692 million shares traded during the same period. The total value of shares traded at the NSE expanded from KSh 8.5 billion to KSh 14.7 billion. Broad money supply (M3), a key indicator for monetary policy formulation, increased from KSh 1,729.6 billion in January 2013 to 1,747.6 billion in February 2013. In contrast, Money and Quasi-money (M2) increased from KSh 1,455.7 billion to KSh 1,471.0 billion over the same period. Gross Foreign Exchange Reserves and Net Foreign Exchange Reserves deflated to 607.2 billion and KSh 330.6 billion respectively, over the same period. Read More