 The Kenya National Bureau of Statistics initiated the process of rebasing and revising the National Accounts in 2010. This is the sixth major revision in the history of national accounts in the country. The main objectives of the revision were; to implement recommendations of 2008 System of National Accounts (2008 SNA), change base year from 2001 to 2009, and incorporate new sources of data that have become available since the previous major revision.
The revision process involved use of a wide range of information from surveys, censuses and administrative records done in a coherent and consistent manner to achieve the overall goal of improved National Accounts statistics. The revision has been finalized for key national accounts estimates while more work is ongoing with a view of expanding the accounts further.
As a result of the revision, a 2009 Supply and Use Tables (SUT) was developed as an integral part of the national accounts estimates. The Supply and Use Tables provides detailed information on the production processes, the interdependencies in production, the use of goods and services and the generation of income in production. The 2009 SUT was published in the Economic Survey 2014. Other output of this revision includes revised annual and quarterly national accounts estimates for the period 2006 to 2013 at current and constant prices which were released on 30th September 2014.
The revised national accounts are generally in accordance with 2008 SNA guideline though there are some departures. It has not been possible to include coverage of illegal activities as recommended by the SNA due to unavailability of data. Furthermore, it has not been possible to measure expenditure on computer software and database and entertainment, literary and artistic originals, which is defined as capital expenditure. Download Revised Quarterly Gross Domestic Product October 2014
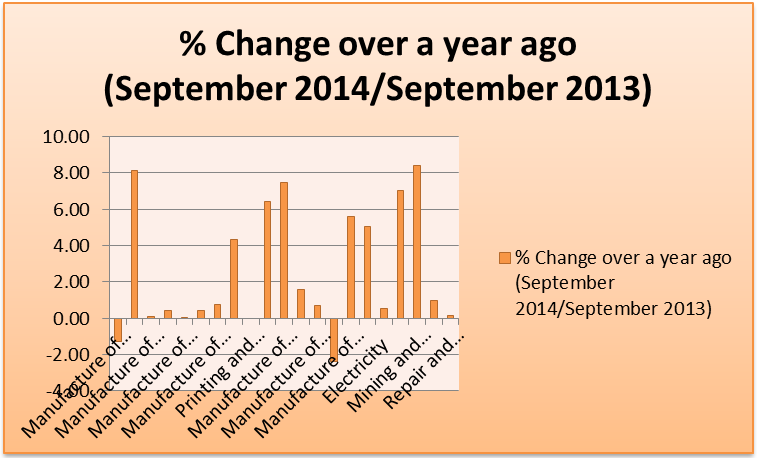 Kenya National Bureau of Statistics hereby releases the Producer Price Index (PPI) for the September quarter of 2014. Producer Price Index measures the gross changes in the trading price of products on the domestic and the non-domestic markets, at all stages of processing. The price changes are measured from the perspective of the producer. The producer prices are collected as at 15th February, 15th May, 15th August and 15th November of the year. These dates corresponds to the first, second, third and fourth quarters respectively.
 Kenya’s Statistical Abstract is the single source of data covering a series of years. The Abstract enables you to get complete time series data of the Kenyan Economy from one SINGLE official source.
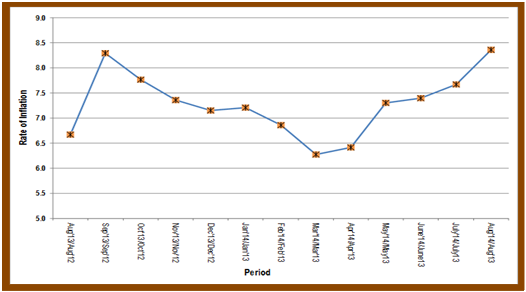 The Leading Economic Indicators for August 2014 highlights trends in Consumer Price Indices (CPI) and inflation, interest rates, exchange rates, international trade, agriculture, energy, manufacturing, building and construction, tourism and transport.