 The overall aim of the 2010 Census of Industrial Production (CIP), was to provide comprehensive information on the structure of the industrial activities in Kenya. The exercise targeted an estimated total of 3,000 registered establishments in the country. The CIP 2010 focused on various characteristics of formal establishments that included the economic activities at the four digit ISIC, employment, ownership structure, production and installed capacity, inventories, intermediate consumption, incomes, sales, ICT and fixed
assets, among others. A total of 1,814 formal establishments/firms responded for the industrial enquiry. Imputations were done for 438 establishments that did not respond based on other regular surveys and other administrative sources. The final results as reflected in the report are aggregated at the two digit (division) of ISIC.
The total output of the industrial sector in 2009 was KSh 1,009.2 billion with total gross value added of KSh 319.8 billion. Manufacturing activities recorded the largest share of industrial production, accounting for 90.3 per cent of total value of industrial output. This was followed by electricity, gas, steam and air conditioning supply which recorded 7.9 per cent of the total output. The total number of persons engaged as at June 2009 was 324,841 with about half of them based in Nairobi. The manufacturing sector accounted for about 94 per cent of total employment within the industrial sector. Most of the employees in industry were males at 77.2 per cent.
A total of 30 per cent of establishments reported capacity utilization below 50 per cent. Some of the key reasons cited by the establishments leading to under-utilization were the high cost of fuels, electricity and raw materials during the reference period.
Overall, the value of inputs into the sector‟s production process was estimated at KSh 701.9 billion, of which KSh 689.3 billion was intermediate consumption. Cost of raw materials constituted 81.2 per cent of the inputs into the process of production activities of sectors.
Energy and water accounted for 8.1 per cent of the input costs while expenditure on other type of inputs amounted to 10.6 per cent. In 2009, inventories were estimated to have reduced by KSh 902.6 million which could have been attributed to an upsurge in economic growth after a slowdown in 2008. Finally, value added (contribution to GDP) of the formal industrial sector was KSh 319.8 billion.
In 2009, the total sales of industry in Kenya was KSh 1,015.4 billion with Manufacturing activities contributing the largest share of sales at 87.7 per cent. Electricity, Gas, Steam and Air Conditioning Supply was second while Water and Sewerage Services had the lowest level of sales at KSh 10.4 billion. Most of the goods produced in Kenya are sold locally, accounting for 83.5 per cent of all sales, East African countries consume 5.4 per cent while 11.8 per cent is exported to the Rest of the World (RoW). Download full report
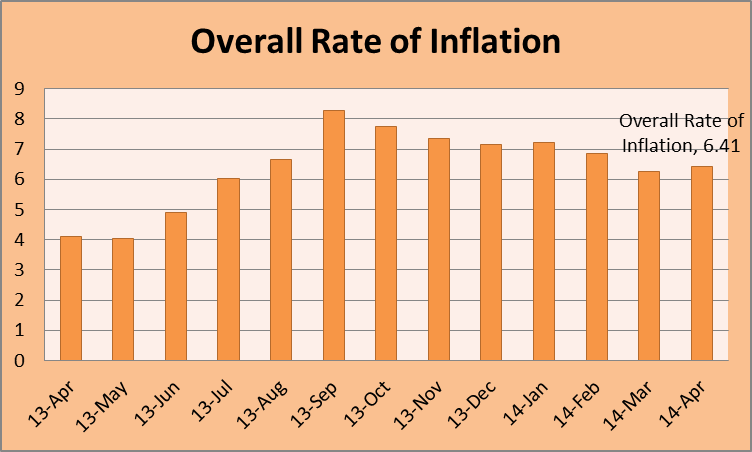 Kenya National Bureau of Statistics hereby releases Consumer Price Indices (CPI) and rates of inflation for April 2014. These numbers have been generated using data collected during the second and third weeks of the month under review. The prices were obtained from selected retail outlets in 25 data collection zones located in 13 urban centers.
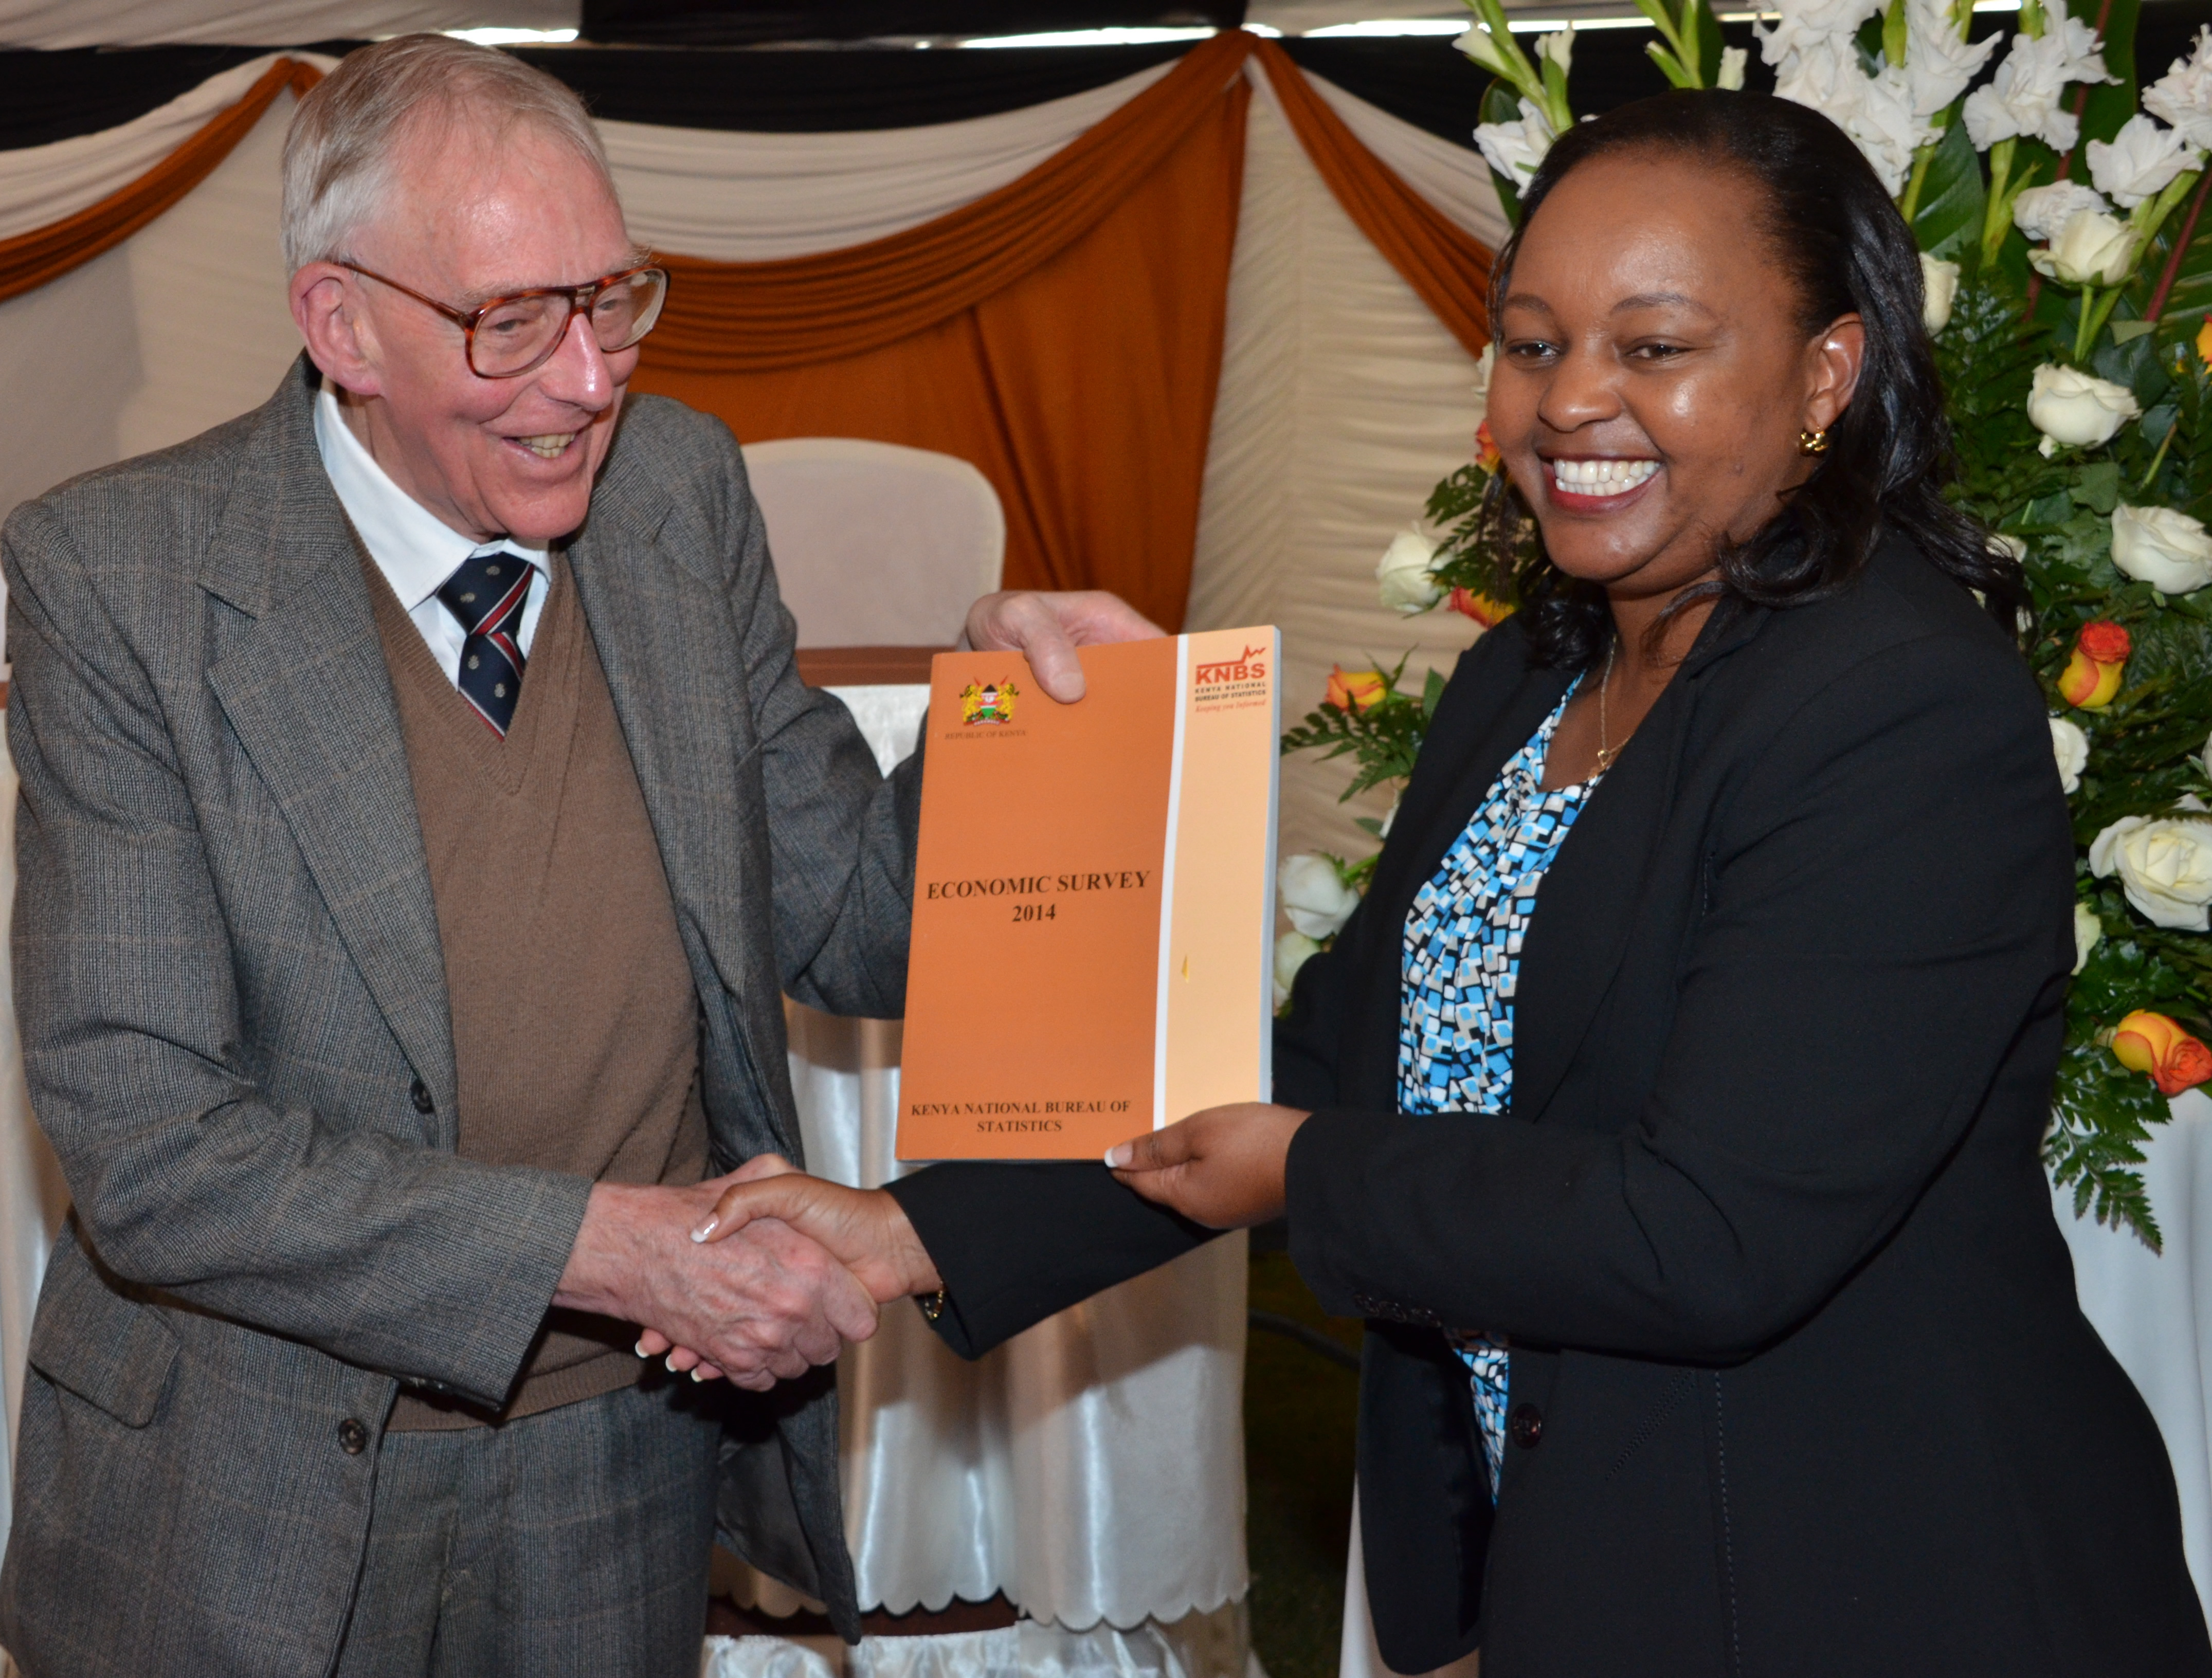 The country’s Gross Domestic Product (GDP) expanded by 4.7 per cent in 2013 compared to 4.6 per cent in 2012.
 The National ICT Survey was undertaken in 2010 and is presented in two sections. Section I presents a report of the National ICT Survey undertaken by the Kenya National Bureau of Statistics (KNBS). Section II is an Analysis of the National ICT Survey by Apoyo Consultoria on behalf of the Communications Commission of Kenya (CCK). The KNBS report provides a descriptive analysis of the Survey while Section II of the report provides detailed analysis of the ICT situation based on the intervening variables in different regions of Kenya as presented by the ICT consultants.