 Before 1993, all foreign exchange transactions were controlled by the Central Bank of Kenya (CBK), and therefore all data on foreign exchange transactions was available. The liberalization of economies has led to large inflows of private capital into the country.
These flows have significant macroeconomic effects on the economy that demand urgent policy responses. Information on the level and composition of private capital flows are important for appropriate and timely decisions by policy makers. Despite of the importance of capital flows information, Kenya has conducted only one survey with a reference period of 2007 and 2008.
Foreign Investment Survey 2013 which captured data on foreign private capital flows and stocks for the period 2009, 2010 and 2011 is an initiative intended to provide more information. The first Foreign Investment Survey (FIS 2010) collected data on a sample of 900 enterprises with foreign transactions/positions.
The second Foreign Investment Survey (FIS 2013) targeted a sample of 500 enterprises which were selected on the basis of FIS 2010. These are enterprises that were found to have foreign transactions during the FIS 2010 and contributed to 90.0 per cent of the total foreign transactions.
The specific objectives of the survey was to; collect data necessary to improve the quality of Balance of Payments (BOP) statistics and compilation of International Investment Position (IIP) statistics, collect data necessary for assessment of investors’ perceptions of the investment climate in the country, with a view to identifying ways to improve it and comply with international standards of compilation and reporting of BOP and IIP statistics.
The main analytical tool for the Foreign Investment Survey 2013 was a questionnaire administered to enterprises with Foreign Assets and Liabilities (FAL). Additional information on flows was sought from Export Processing Zones Authority (EPZA), CBK, Capital Markets Authority (CMA) and Kenya Investment Authority (KenInvest). The survey was designed to capture data on foreign private capital for the reference period 2009, 2010 and 2011 and investor perceptions on the business environment in 2013.
The implementation of the survey was broadly in five stages namely; survey design and sourcing of funds; training of personnel and data collection; data capture and editing; data analysis and report writing and the dissemination of the results. The FIS 2013 personnel were intensively trained and the data collection exercise took three months. Sensitization of potential respondents through press advertisement while software development for the survey database by Macroeconomic and Financial Management Institute of Eastern and Southern Africa (MEFMI) in collaboration with the Bureau, was done prior to the commencement of the data collection.
Foreign Liabilities
The stock of Foreign Liabilities increased by 16.9 per cent from KSh 526,262 million in 2009 to KSh 615,088 million in 2010. The stock of Foreign Direct Investment (FDI), Other Investment (OI), Portfolio Investment (PI) accounted for 65.2, 19.3 and 15.5 per cent of the total liabilities respectively, in 2010. In 2011, the stock of foreign liabilities increased by 14.0 per cent from KSh 615,088 million in 2010 to KSh 701,479 million. The stock of FDI had the largest share of 65.9 per cent, followed by Other Investment with a share of 19.0 per cent and Portfolio Investment accounting for 15.0 per cent of the total liabilities in 2011.The United Kingdom and Mauritius were the main sources of inflows each accounting for 20.4 per cent and 36.2 per cent in 2010 and 31.7 per cent and 34.8 per cent in 2011 of the total inflows. Inflows from China accounted for 20.3 per cent of the total inflows in 2010 and 4.7 per cent in 2011. South Africa’s share of total inflows in 2010 was 2.0 per cent while in 2011 was 5.1 per cent. Inflows from Belgium accounted for 5.6 per cent of the total inflows in 2011.Manufacturing was the major investment sector by foreign investors accounting for 19.3, 21.5 and 21.4 per cent of the total external liabilities in 2009, 2010 and 2011 respectively. Financial and insurance activities and Electricity, gas, steam and air conditioning supply sectors came second and third with Human health and social work activities sector accounting for the least share of total liabilities of approximately 0.03 per cent on average across the reference period.
Total foreign liability inflows and outflows increased by 16.9 per cent and 52.6 per cent to KSh 201,704 million and KSh 89,664 million in 2010 compared to KSh 172,518 million and KSh 58,767 million recorded in 2009. This resulted into a decline of 1.5 per cent in the total net inflows in 2010. However, in 2011 the net inflows increased by 18.0 per cent to stand at KSh 132,261 million compared to KSh 112,040 million recorded in 2010. Foreign Direct Investment inflows contributed the largest component of total inflows in 2010 accounting for 73.9 per cent. In 2011, inflows in the form of direct investments increased by 33.0 per cent from KSh 149,122 million in 2010 to KSh 198,398 million and accounted for 71.8 per cent of the total inflows. Inflows were mainly in the form of Equity and Investment Fund Shares and short term debt instruments. In 2011, inflows of Portfolio Investment increased by 39.0 per cent to KSh 44,434 million from KSh 31,974 million in 2010. Other Investment inflows increased by 63.2 per cent in 2011 compared to a growth of 52.4 per cent in 2010. Inflows of Other Investment in 2010 were mainly driven by short term trade credits and advances whereas in 2011 were on account of long term loans which more than tripled.
Total outflows of external liabilities increased by 52.6 per cent from KSh 58,767 million in 2009 to KSh 89,664 million in 2010. Similarly, outflows of total foreign liabilities increased by 60.8 per cent to KSh 144,204 million in 2011. Foreign Direct Investment outflows increased by 92.7 per cent in 2010 due to increase in short term outflows of debt instruments which more than doubled during the same period. Outflows of Foreign Direct Investments in 2011 increased by 60.3 per cent to KSh 86,933 million accounting for 60.3 per cent of the total outflows. In 2010, Portfolio Investment outflows more than doubled whereas outflows of Other Investment contracted by 14.5 per cent to KSh 19,849 million. The decline in Other Investment outflows was mainly in short term Accounts payables/receivables. In 2011, outflows of Other Investment followed a similar trend decreasing by 9.3 per cent mainly on account of decline in long term loans.
Foreign Assets
The total stock of Kenya’s foreign assets increased from KSh 28,767 million in 2009 to KSh 42,272 million in 2010 and to KSh 63,005 million in 2011.Foreign Direct Investment, Portfolio Investment and Other Investment registered an upward trend in the three years. The increase in Foreign Direct Investment was mainly on Equity and Investment Fund share, which increased by 26.4 per cent to KSh 11,731 million in 2010 and more than doubled to KSh 27,141 million in 2011. Short term debt instruments increased by 87.0 per cent to KSh 18,133 million in 2010 but decreased by 3.9 per cent to KSh 17,419 million in 2011.Within Portfolio investment, long term debt securities increased from KSh 43.2 million to KSh 325 million and to KSh 408 million in 2009, 2010 and 2011, respectively. Under Other Investments, long term trade credits and advances increased by 19.1 per cent in 2010 and 56.2 per cent in 2011. Short term accounts receivables/payables increased by 13.0 per cent from KSh 556 million in 2009 to KSh 628 million in 2010 but declined by 22.1 per cent to KSh 489 million in 2011.The country’s external assets were pre-dominantly held in Africa, with the least assets being held in Australia and Oceanic. Total external assets held in Africa in 2009, 2010 and 2011 stood at KSh 15,971 million, KSh 19,086 million and KSh 42,888 million respectively, translating into a share of 55.5, 45.2 and 68.1 per cent of the total stock of external assets, respectively.
Trade in Services
The amount paid for services provided by non-residents to Kenyans firms increased from KSh 29,387 million in 2009 to KSh 29,766 million in 2010 then to KSh 39,754 million in 2011 representing overall growth of 35.3 per cent. The huge jump between 2010 and 2011 was attributed to significant growth in amount paid for services provided in construction service and sectors. Amount paid by firms in construction sector more than doubled from KSh 1,359 million in 2010 to KSh 4,483 million in 2011 while that in telecommunication, computer & information service grew by 36.6 per cent from KSh 18,878 million in 2010 to KSh 25,778 million in 2011.
Investor Perception
Both customs & excise duty and corporate tax were viewed as having a negative effect on business by most enterprises during the survey. Access to domestic and international markets were however rated to have a net positive effect on business operations. Domestic sources of finance remained the major sources of project financing, though some firms indicated reliance on regional and international finance to drive their growth agenda. However, a large proportion of the respondents indicated that interest rates, inflation and exchange rate had a net negative effect on business operations.
Internet services had positive impact on business operations while electricity supply continued to impact negatively on investments decisions. Water and postal services were found to have a net positive effect as indicated by over half of the respondents. Banking and insurance services also had positive effect on business operations and although firms indicated that credit was expensive, it was easier to access. Download Foreign Investment Survey 2013
 Kenya’s economy is estimated to have expanded by 5.5 per cent during the third quarter of 2014 compared to a revised growth of 6.2 per cent in the same period of 2013 The growth was mainly supported by strong expansions of activities in construction; finance and insurance; wholesale and retail trade; information and communication; and agriculture and forestry.
 The Leading Economic Indicators for the month of November 2014 highlights trends in Consumer Price Indices (CPI) and inflation, interest rates, exchange rates, international trade, agriculture, energy, manufacturing, building and construction, tourism and transport.
 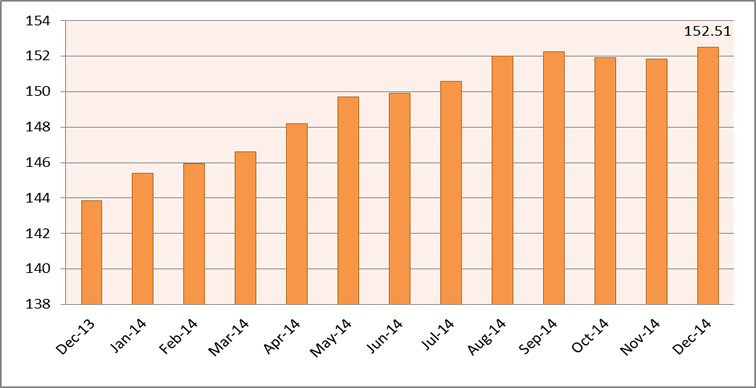 Kenya National Bureau of Statistics hereby releases Consumer Price Indices (CPI) and inflation rates for December 2014. These numbers have been generated using data collected during the second and third weeks of the month under review. The prices were obtained from selected retail outlets in 25 data collection zones located in 13 urban centers.
 Kenya National Bureau of Statistics held a workshop on microdata outreach and advocacy. The two-day activity themed Bringing together users and producers of data, aimed at emphasizing collaboration between users and producers of data.
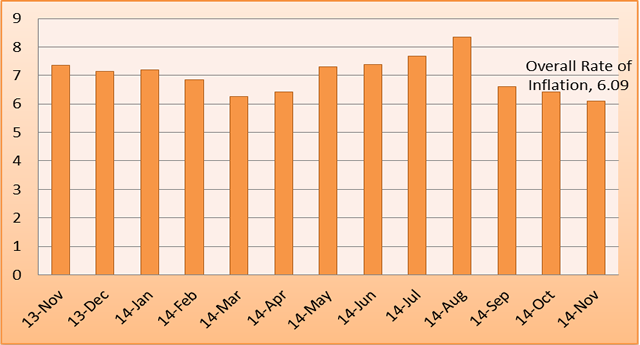 Kenya National Bureau of Statistics hereby releases Consumer Price Indices (CPI) and inflation rates for November 2014. These numbers have been generated using data collected during the second and third weeks of the month under review. The prices were obtained from selected retail outlets in 25 data collection zones located in 13 urban centers.
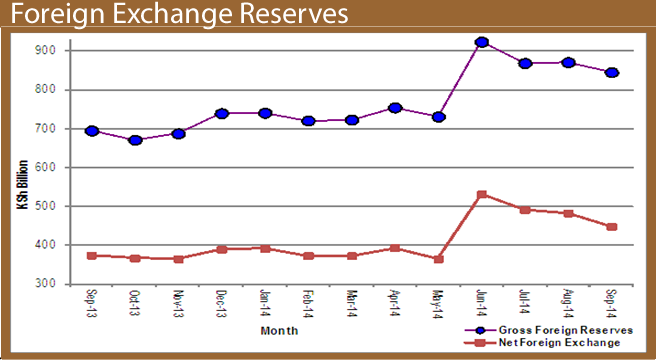 The Leading Economic Indicators for the month of October 2014 highlights trends in Consumer Price Indices (CPI) and inflation, interest rates, exchange rates, international trade, agriculture, energy, manufacturing, building and construction, tourism and transport.
 Tobacco use is one of the most common risk factors for non-communicable diseases (NCDs). According to the Kenya Ministry of Health, NCDs contribute to nearly 50% of all admissions in public hospitals countrywide. In Kenya, 69 per 100,000 deaths for individuals aged 30 and above result from tobacco use. Five percent of all non-communicable deaths in Kenya result from tobacco use, and 55% of all deaths from cancers of the trachea, bronchitis, and lung are attributable to tobacco.
 Today, we join our colleagues across the Continent in commemorating the African statistics day. As we celebrate, we take cognizance of the many achievements we have made in statistics.